29 Countries, One Mirror: What Europe’s Consumer Conditions Scoreboard 2025 Quietly Reveals About How You Really Live, Shop and Get Protected
A consumer-protection reading of the European Commission’s 2025 edition — for expats, students and teaching staff in the EU
An explainer by InfoCons
Every November, a quiet but remarkable thing happens across Europe. Thousands of ordinary people — in Lisbon and Ljubljana, in Helsinki and Heraklion, in Reykjavík and Bucharest — answer the same set of questions about their everyday lives as consumers. Are they worried about paying their bills? Have they noticed their favourite biscuits shrinking in the packet? Did the dress they ordered online ever arrive, and was it the right size? Were they pressured by a sales call they never asked for? Those answers, gathered and weighed, become one of the most useful and underused public documents in the European Union: the Consumer Conditions Scoreboard.
Published by the European Commission’s Directorate-General for Justice and Consumers, the 2025 edition draws its central evidence from the Consumer Conditions Survey carried out in November 2024 by Ipsos. It is, in effect, a health check on the consumer experience — a way of asking, year after year, whether the Single Market actually feels fair, safe and affordable to the people who live inside it. For anyone teaching, studying or simply living and shopping across European borders, it is a goldmine hiding in plain sight.
This article explains what the Scoreboard is, how many countries it covers, what its main themes are, and — crucially — how you can use it. It is written with English-speaking readers in mind: expatriates navigating an unfamiliar consumer-rights landscape, and the students and lecturers in English-language university departments across the EU who need a clear, expert entry point into European consumer policy.
Contents
What Exactly Is the European Consumer Conditions Scoreboard?
Why a common yardstick matters so much
How It Helps Us as European Citizens — Especially Expats, Students and Teachers
For expatriates: a map of the consumer landscape you just moved into
For students: a ready-made dataset and case study
For teaching staff: a current, authoritative reference in English
The Five Big Themes of the Scoreboard
Theme 1 — Cost-of-Living
Theme 2 — E-Commerce and Digital Fairness
Theme 3 — The Green Transition
Theme 4 — Experience of Problems and Redress
Theme 5 — Knowledge, Trust and Product Safety
The Country Comparison: 29 Pie-Chart Profiles
From Data to Daily Life: Putting the Scoreboard to Work
Conclusion: A Mirror Worth Looking Into
The 29 Countries Covered by the Scoreboard
What Exactly Is the European Consumer Conditions Scoreboard?
InfoCons Consumer Protection
The Scoreboard is a recurring monitoring exercise. Its stated purpose is to track the consumer environment across Europe and to make that environment measurable, comparable and transparent. Rather than relying only on the impressions of regulators or the lobbying of industry, it puts the experiences of consumers themselves at the centre — and it does so using a survey designed to be representative of the adult population in each participating country.
The headline data source is the Consumer Conditions Survey, conducted between 4 and 29 November 2024. Fieldwork was carried out by telephone among representative samples of people aged 18 and over. In most participating countries the sample size was 1,000 respondents; in four smaller markets — Luxembourg, Malta, Cyprus and Iceland — it was 500. To put the survey findings into context, the Commission layers in official statistics from sources such as Eurostat, the European Consumer Centres Network and the EU’s Safety Gate rapid alert system.
The geographic scope is one of the Scoreboard’s defining strengths. It covers the 27 EU Member States plus two members of the European Economic Area — Iceland and Norway — giving a total of 29 countries measured against the same questions and the same yardstick. That common methodology is what allows a reader to place, say, Romania next to Denmark, or Spain next to Finland, and compare like with like.
Why a common yardstick matters so much
InfoCons Consumer Protection
National consumer statistics are notoriously hard to compare. Different surveys ask different questions, in different years, with different definitions. The Scoreboard removes that friction. Because every country answers an identical questionnaire in the same month, the differences that emerge are real differences in experience — not artefacts of survey design. For a researcher this is invaluable; for a citizen moving between countries, it is the difference between guesswork and evidence.
How It Helps Us as European Citizens — Especially Expats, Students and Teachers
InfoCons Consumer Protection
The Scoreboard is not just a report for officials. Its comparative, country-by-country design makes it directly useful to ordinary people, and three audiences benefit in particular.
For expatriates: a map of the consumer landscape you just moved into
InfoCons Consumer Protection
When you relocate to a new EU country, you inherit a new consumer culture overnight. Are people there generally confident that products on the shelves are safe? Do most consumers trust retailers to respect their rights — and is that trust well founded? How common is aggressive sales pressure, and how satisfied are people when they complain? The Scoreboard answers these questions with hard numbers, and it lets you benchmark your new home against the EU average and against the country you came from. That context can save you money, time and a good deal of frustration.
For students: a ready-made dataset and case study
InfoCons Consumer Protection
For anyone studying economics, law, marketing, public policy, European studies or consumer behaviour, the Scoreboard is an exceptional teaching and research resource. It offers harmonised, recent, EU-wide data that can anchor an essay, a dissertation, a seminar debate or an empirical project. Its annexes document the exact survey questions and the official statistical sources behind every figure, which makes it possible to cite responsibly and to interrogate the methodology — a skill in itself.
For teaching staff: a current, authoritative reference in English
InfoCons Consumer Protection
Lecturers in English-language departments across the EU often need authoritative, up-to-date material that does not require translation and that students can access freely. The Scoreboard is published in English, is openly licensed for reuse with attribution, and is updated regularly. It can illustrate abstract concepts — market fairness, asymmetric information, the cost-of-living squeeze, the economics of repair — with concrete, contemporary European evidence.
Snapshot: scope and method of the 2025 edition
|
Feature |
2025 edition |
|
Countries covered |
29 (EU27 + Iceland + Norway) |
|
Main data source |
Consumer Conditions Survey, November 2024 (Ipsos) |
|
Fieldwork dates |
4–29 November 2024, by telephone |
|
Sample size |
1,000 per country (500 in LU, MT, CY, IS) |
|
Respondents |
Adults aged 18 and over |
|
Contextual sources |
Eurostat, ECC Net, Safety Gate |
|
Main themes |
Five thematic chapters + a country-by-country annex |
The Five Big Themes of the Scoreboard
InfoCons Consumer Protection
The body of the Scoreboard is organised around five thematic areas, each capturing a different dimension of the modern consumer experience. The sections below walk through each theme in turn, with the headline findings of the 2025 edition.
Theme 1 — Cost-of-Living: Inflation Eased, but the Pressure Lingers
InfoCons Consumer Protection
The period of rapidly rising prices that followed Russia’s full-scale invasion of Ukraine in February 2022 subsided over the course of 2024. The EU27 annual rate of inflation stood at 2.7% in December 2024, dramatically lower than the 11.5% peak recorded in October 2022. Yet the relief on paper has not fully translated into relief in people’s minds.
Worries about household finances remain stubborn. In the 2024 survey, 38% of consumers were concerned about being able to pay their bills (down from 48% in 2022), and 35% worried about affording the food products they like (down from 44%). The improvement is real, but the baseline of anxiety is still high — and consumer confidence, having recovered from its 2022 low, began slipping again towards the end of 2024.
Part of the explanation is that prices did not fall; they simply stopped rising as fast. Energy prices paid by EU consumers were 44.3% higher in December 2024 than in January 2021, even after easing from their highs. Food and non-alcoholic beverage prices rose 31.9% over the same period. Some everyday staples climbed far more steeply still: olive oil almost doubled (a 99.6% increase), sugar rose 48.6%, and fruit and vegetable juices and potatoes increased by more than 40%. Butter, rice, bread, eggs and cheese each rose by more than a third.
One of the Scoreboard’s most relatable findings is the phenomenon of “shrinkflation.” Around three-quarters of EU consumers (74%) said they had noticed the size or quantity of some packaged products shrink while the price stayed the same or rose. Just over half (52%) noticed ingredients or quality getting worse without any price cut. The chocolate bar really did get smaller — and the data proves it was not your imagination.
The chapter also draws on a Commission study of consumer over-indebtedness. According to Eurostat, 9.3% of EU households were in arrears with their key financial commitments in 2023, up from 8.8% in 2020. Single-parent households were the most exposed, with 18.1% facing debt-related difficulties. Rising living costs, falling incomes and the higher cost of debt are the principal drivers, and the report’s recommendations centre on financial literacy, debt-advisory services and responsible lending.
Selected food and non-alcoholic price increases, January 2021 to December 2024 (EU27)
|
Product |
EU27 increase |
Tier |
|
Olive oil |
+99.6% |
Extreme |
|
Sugar |
+48.6% |
Very high |
|
Fruit & vegetable juices |
+42% |
Very high |
|
Potatoes |
+41% |
Very high |
|
Butter / rice / bread / eggs / cheese |
> +33% |
High |
|
Food & non-alcoholic beverages (overall) |
+31.9% |
High |
Theme 2 — E-Commerce and Digital Fairness: More Shopping, More Problems
InfoCons Consumer Protection
Online shopping continues its steady march across Europe. The overall share of consumers buying online rose from 71% in 2022 to 76% in 2024. Cross-border commerce grew faster still: more than a third of consumers (35%) bought from another EU country in 2024, up from 27% in 2022, while over a quarter (27%) bought from outside the EU, up from 20%. The volume of low-value parcels entering the EU has exploded — 4.6 billion consignments worth up to EUR 150 were imported in 2024, almost double the 2.4 billion of 2023 and more than triple the 1.4 billion of 2022. That is more than 12 million small packages every single day.
But convenience comes with risk. Online shoppers are over 60% more likely to run into trouble than offline shoppers: 26% of those who bought online experienced a problem they felt justified a complaint, compared with 16% of offline consumers. The digital marketplace, in other words, is both the future of consumption and its most error-prone frontier.
Misleading practices are widespread. Two-thirds of online buyers (66%) encountered fake consumer reviews at least sometimes, and 61% noticed discounts that seemed too large to be genuine. Two in five (40%) reported confusing, misleading or biased presentation of information. Fraud is a growing shadow over the digital economy: 45% of consumers encountered some form of online fraud in 2024, most commonly fake appeals for money to relieve financial hardship (23%) and phishing for personal data (21%). Exposure varied enormously by country, from 29% in Finland to 85% in Austria.
Privacy concerns are nearly universal among online shoppers. A striking 93% reported worries about online targeted advertising. The leading concerns were the collection of personal data without consent (71%), excessive advertising (67%) and unavoidable personalisation (63%). Only 6% said they had no concerns at all.
The chapter situates these findings against the EU’s policy response. The Digital Fairness Fitness Check, published in October 2024, concluded that the core consumer directives remain relevant but only partially achieve their aim of high protection online — pointing, among other things, to manipulative “dark patterns” in online interfaces. A forthcoming Digital Fairness Act is intended to close those gaps with more specific, targeted rules. The European Consumer Centres Network, meanwhile, handled more than 135,000 queries in 2024, of which 73.4% related to online purchases; the share of e-commerce queries escalated to formal complaints rose from 17.7% in 2020 to 22.8% in 2024.
Theme 3 — The Green Transition: Good Intentions Meet Hard Budgets
InfoCons Consumer Protection
Consumers are central to the green transition, yet the 2025 Scoreboard records a notable retreat in environmentally motivated buying. The share of consumers who said environmental impact influenced at least one or two recent purchases fell to 43% in 2024 — a 13 percentage-point drop since 2022. This decline was observed in 23 of the 27 EU Member States. Younger, more educated and better-off consumers remained the most likely to weigh the environment in their choices.
The barriers are revealing. Just over two-thirds of consumers (67%) said that the expense of sustainable products and services stopped them buying more of them. Similar proportions cited confusion about which products are genuinely eco-friendly (62%) and mistrust of environmental claims (62%). Trust in green claims itself slipped: half of respondents (50%) agreed that most environmental claims are reliable, down six points since 2022.
Repair — a cornerstone of a circular, less wasteful economy — tells a similar story of cost and convenience. Among consumers whose durable product (a smartphone, laptop or fridge, for example) broke down after its guarantee expired, similar shares replaced it with a new one (40%) or repaired it (35%), while only 9% chose a second-hand or refurbished replacement. Among those who chose not to repair, the dominant reason was cost (61%), followed by the sheer effort involved (32%). The cost-of-living squeeze, in short, is quietly undermining sustainable consumption.
Theme 4 — Experience of Problems and Redress: Complaints Are Resolved, but Satisfaction Is Falling
InfoCons Consumer Protection
Monitoring how often consumers hit problems — and how well those problems are resolved — is a direct measure of marketplace fairness. In 2024, 24% of EU consumers reported a problem in the previous 12 months with a domestic purchase that they felt justified a complaint. Of these, close to three-quarters (73%) took some action to address it.
Where do people turn? Most went straight to the retailer or service provider (85%), while around a third complained to the manufacturer (32%). Formal legal routes remained rare: 5% took a business to court, 4% joined a collective redress action, and just 9% used an out-of-court alternative dispute resolution (ADR) body. Among the 27% who experienced a problem but did nothing, the reasons were telling: the time required (57%), doubt that complaining would achieve anything (51%), the small value of the purchase (45%), not knowing where to complain (41%), and uncertainty about their own rights (33%).
The most worrying trend in this chapter is satisfaction. The share of complainants who were very or fairly satisfied with how retailers handled their complaint fell from 65% in 2022 to 53% in 2024. Satisfaction dropped in 20 of the 27 Member States. And the single most common unfair practice reported across the EU was pressure selling through persistent sales calls or messages, experienced by 45% of consumers.
Theme 5 — Knowledge, Trust and Product Safety: Confidence Holds, Understanding Lags
InfoCons Consumer Protection
Trust in the marketplace returned to pre-pandemic levels in 2024. Seven in ten consumers (70%) agreed that retailers and service providers respect their rights, and 61% trusted public organisations to protect those rights. Trust varied by age and financial situation, with younger people generally more trusting and those in financial difficulty less so.
Yet knowledge of consumer rights remains patchy. In 2024, 59% knew they could return distance-purchased goods within 14 days, and 56% knew a contract could not raise prices significantly without an option to cancel. Fewer than half (44%) understood their right to a free repair or replacement when a new product fails within two years, and only 31% knew they were not obliged to pay for unsolicited goods. Overall, more than a third of consumers (35%) had a low level of knowledge of their rights, against just 29% with high knowledge.
On product safety, confidence is high and stable: 68% of consumers were generally confident that the products they buy are safe (17% believing all are safe, 51% that most are). Actual harm is rare — 14% reported a product-related safety issue in the last two years, more than half of whom did not complain, and only 2% reported an injury to a household member from a dangerous product. Awareness of recalls is widespread, with 56% having seen a recall notice and 13% experiencing a recall for a product they owned.
Behind that confidence sits a sharp rise in vigilance. The EU’s Safety Gate rapid alert system for dangerous non-food products processed 4,137 alerts in 2024 — a 22% increase on 2023 and a 95% jump on 2022 — driven in part by the new General Product Safety Regulation. Products originating in China accounted for 40% of alerts and those from Italy for 16%. Chemical risks were the most frequently flagged hazard at 49%, especially in cosmetics, jewellery and toys, followed by injuries (14%), environmental risks (8%), and choking and electric-shock hazards (7% each).
The five themes at a glance — one headline figure each (EU27, 2024)
|
Theme |
Headline finding |
Figure |
|
Cost-of-living |
Noticed packaged products shrink in size |
74% |
|
E-commerce & digital fairness |
Online buyers worried about targeted advertising |
93% |
|
Green transition |
Influenced by environment for ≥1 purchase (−13 pp) |
43% |
|
Problems & redress |
Satisfied with complaint handling (down from 65%) |
53% |
|
Knowledge, trust & safety |
Confident products they buy are safe |
68% |
The Country Comparison: 29 Pie-Chart Profiles
InfoCons Consumer Protection
Beyond the thematic chapters, the Scoreboard’s real comparative power lives in its country annex, where each participating country is measured against the EU27 average on six key indicators. To make those profiles instantly readable, this section turns the data into a pie chart for every country, followed by a short explanation beneath each one.
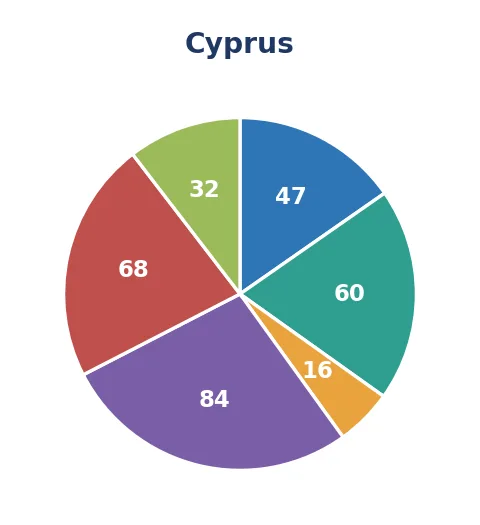
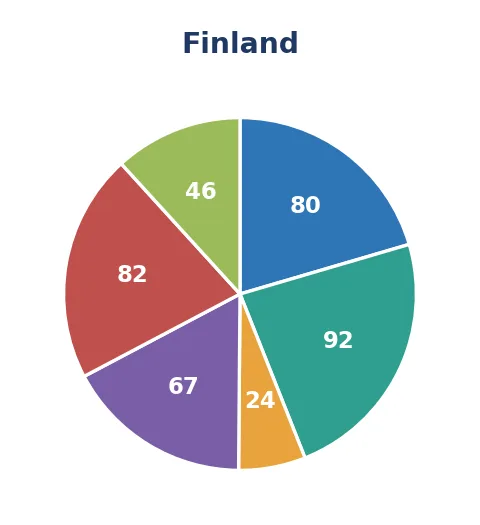
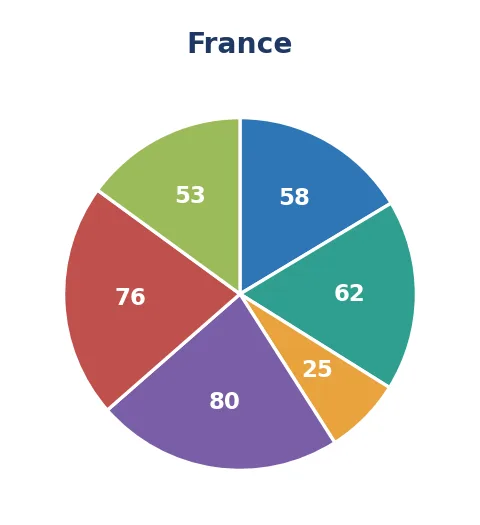
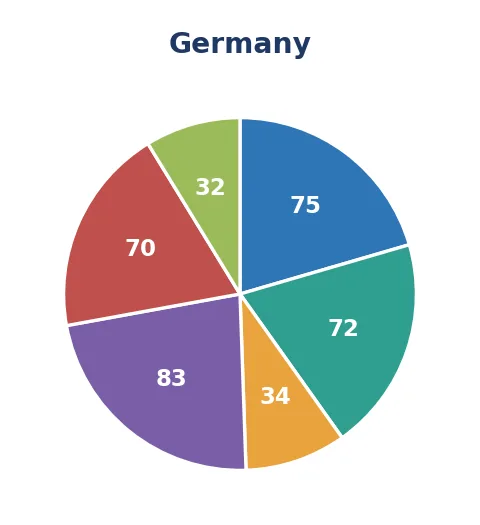
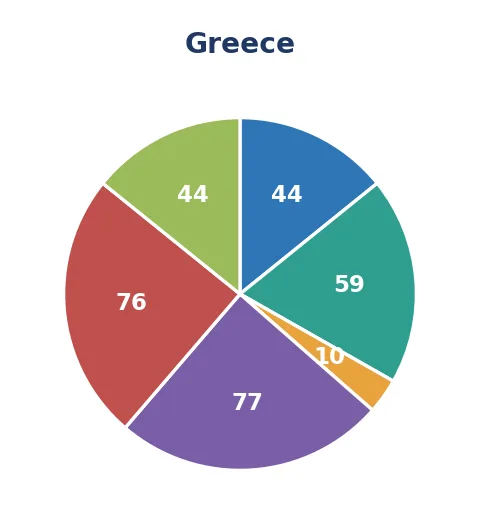
The six indicators are: trust in retailers (confidence that retailers and service providers respect consumer rights); product-safety confidence (confidence that products on the market are safe); high knowledge of rights (the share with a high level of consumer-rights knowledge); a problem-free experience (the share who met no problems with domestic purchases); online purchasing (bought online in the past 12 months); and attention to the environment (environmental impact influenced at least one recent purchase).
A note on reading the charts: each slice is sized in proportion to that indicator’s score, so the six measures can be compared at a glance within a single country, and countries can be compared with one another by the relative size of matching slices. The slices are independent percentages and are not intended to sum to 100; the pie is used here as a compact visual fingerprint of a country’s consumer climate, not as a part-to-whole breakdown.
Legend — the six indicators and their colours (used in every chart below)
|
Trust in retailers |
Product-safety confidence |
High knowledge of rights |
|
Problem-free experience |
Online purchasing |
Attention to environment |
The EU27 benchmark
InfoCons Consumer Protection
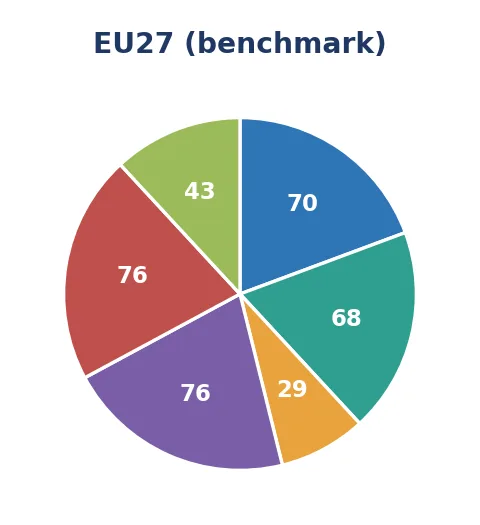
This is the EU27 benchmark — the average across all 27 Member States. Every country profile below should be read against these reference values: trust in retailers 70%, product-safety confidence 68%, high knowledge of rights 29%, a problem-free experience 76%, online purchasing 76% and attention to the environment 43%.
The 29 country profiles
InfoCons Consumer Protection
|
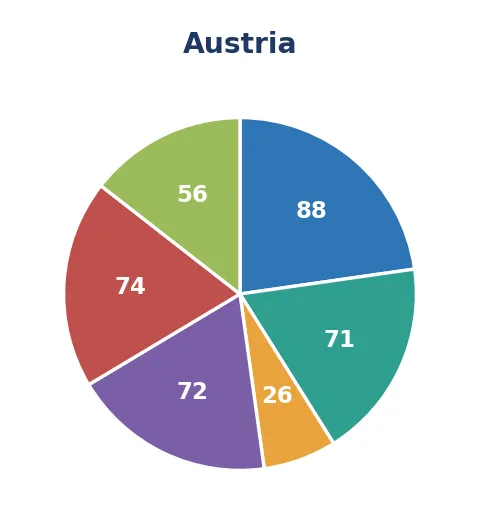
Relative to the EU27, Austria's strongest position is in trust in retailers (88%, 18 points above the EU benchmark of 70%), while its weakest is in a problem-free shopping experience (72% against the EU's 76%). Overall it beats the European average on 3 of the six indicators — including trust in retailers, product-safety confidence and attention to the environment — and its highest single score is trust in retailers at 88%. |
Relative to the EU27, Belgium's strongest position is in trust in retailers (77%, 7 points above the EU benchmark of 70%), while its weakest is in online purchasing (75% against the EU's 76%). Overall it beats the European average on 5 of the six indicators, with its highest single score being a problem-free shopping experience at 79%. |
|
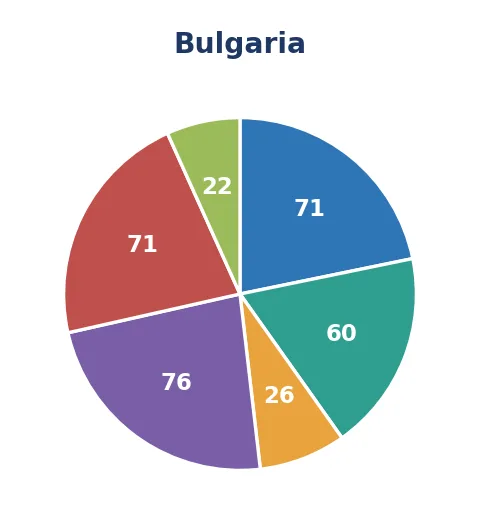
Relative to the EU27, Bulgaria's strongest position is in trust in retailers (71%, 1 point above the EU benchmark of 70%), while its weakest is in attention to the environment (22% against the EU's 43%). Overall it beats the European average on 1 of the six indicator — including trust in retailers — and its highest single score is a problem-free shopping experience at 76%. |
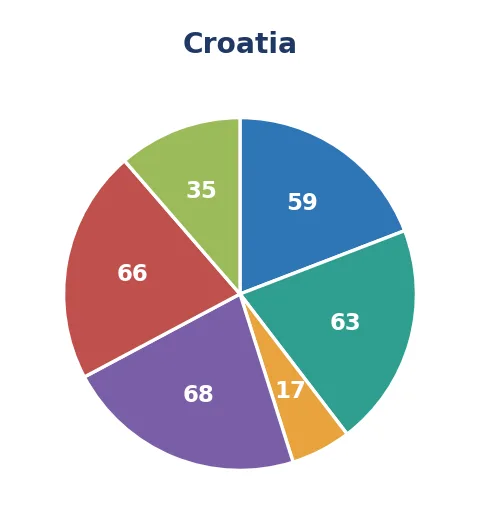
Relative to the EU27, Croatia's strongest position is in product-safety confidence (63%, 5 points below the EU benchmark of 68%), while its weakest is in high knowledge of rights (17% against the EU's 29%). It sits below the European average on all six measures, and its single highest score is a problem-free shopping experience at 68%. |
|
Relative to the EU27, Cyprus's strongest position is in a problem-free shopping experience (84%, 8 points above the EU benchmark of 76%), while its weakest is in trust in retailers (47% against the EU's 70%). Overall it beats the European average on 1 of the six indicator — including a problem-free shopping experience — and its highest single score is a problem-free shopping experience at 84%. |
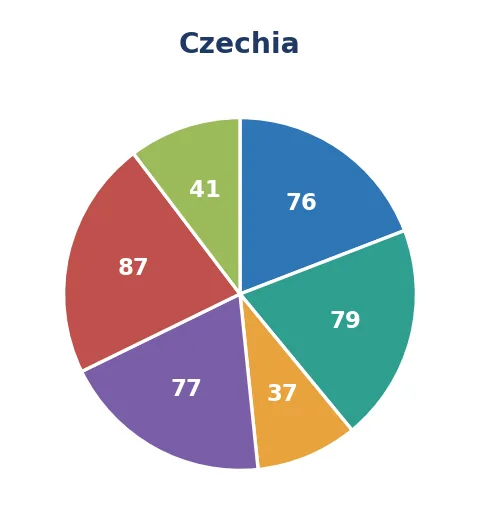
Relative to the EU27, Czechia's strongest position is in product-safety confidence (79%, 11 points above the EU benchmark of 68%), while its weakest is in attention to the environment (41% against the EU's 43%). Overall it beats the European average on 5 of the six indicators, with its highest single score being online purchasing at 87%. |
|
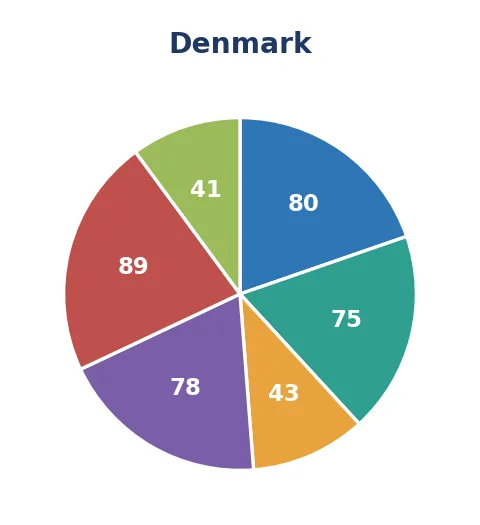
Relative to the EU27, Denmark's strongest position is in high knowledge of rights (43%, 14 points above the EU benchmark of 29%), while its weakest is in attention to the environment (41% against the EU's 43%). Overall it beats the European average on 5 of the six indicators, with its highest single score being online purchasing at 89%. |
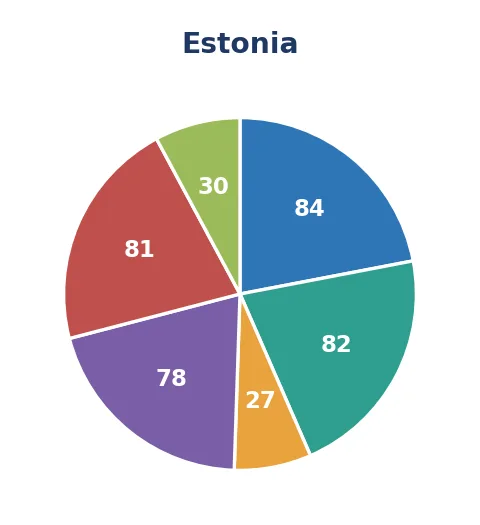
Relative to the EU27, Estonia's strongest position is in trust in retailers (84%, 14 points above the EU benchmark of 70%), while its weakest is in attention to the environment (30% against the EU's 43%). Overall it beats the European average on 4 of the six indicators, with its highest single score being trust in retailers at 84%. |
|
Relative to the EU27, Finland's strongest position is in product-safety confidence (92%, 24 points above the EU benchmark of 68%), while its weakest is in a problem-free shopping experience (67% against the EU's 76%). Overall it beats the European average on 4 of the six indicators, with its highest single score being product-safety confidence at 92%. |
Relative to the EU27, France's strongest position is in attention to the environment (53%, 10 points above the EU benchmark of 43%), while its weakest is in trust in retailers (58% against the EU's 70%). Overall it beats the European average on 2 of the six indicators — including a problem-free shopping experience and attention to the environment — and its highest single score is a problem-free shopping experience at 80%. |
|
Relative to the EU27, Germany's strongest position is in a problem-free shopping experience (83%, 7 points above the EU benchmark of 76%), while its weakest is in attention to the environment (32% against the EU's 43%). Overall it beats the European average on 4 of the six indicators, with its highest single score being a problem-free shopping experience at 83%. |
Relative to the EU27, Greece's strongest position is in a problem-free shopping experience (77%, 1 point above the EU benchmark of 76%), while its weakest is in trust in retailers (44% against the EU's 70%). Overall it beats the European average on 2 of the six indicators — including a problem-free shopping experience and attention to the environment — and its highest single score is a problem-free shopping experience at 77%. |
|
Relative to the EU27, Hungary's strongest position is in trust in retailers (82%, 12 points above the EU benchmark of 70%), while its weakest is in high knowledge of rights (18% against the EU's 29%). Overall it beats the European average on 3 of the six indicators — including trust in retailers, product-safety confidence and online purchasing — and its highest single score is trust in retailers at 82%. |
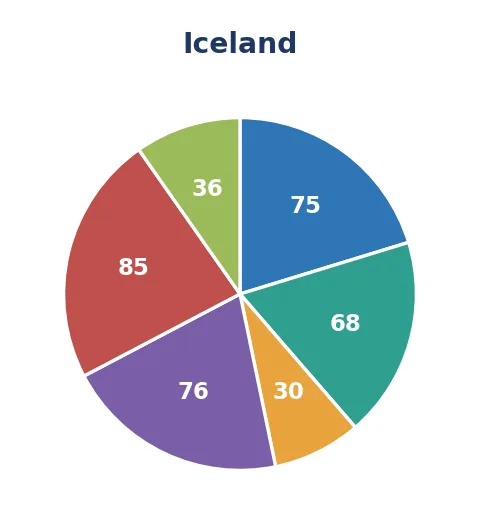
Relative to the EU27, Iceland's strongest position is in online purchasing (85%, 9 points above the EU benchmark of 76%), while its weakest is in attention to the environment (36% against the EU's 43%). Overall it beats the European average on 3 of the six indicators — including trust in retailers, high knowledge of rights and online purchasing — and its highest single score is online purchasing at 85%. |
|
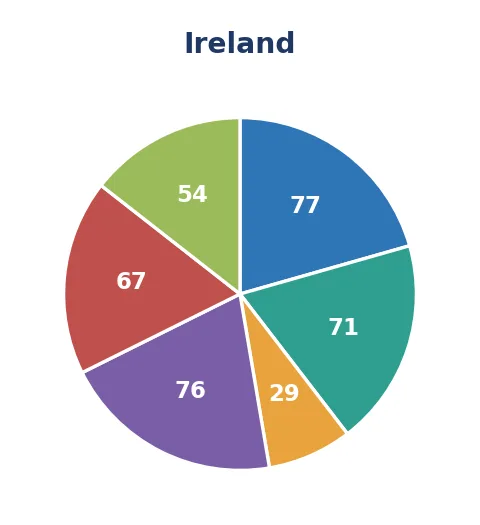
Relative to the EU27, Ireland's strongest position is in attention to the environment (54%, 11 points above the EU benchmark of 43%), while its weakest is in online purchasing (67% against the EU's 76%). Overall it beats the European average on 3 of the six indicators — including trust in retailers, product-safety confidence and attention to the environment — and its highest single score is trust in retailers at 77%. |
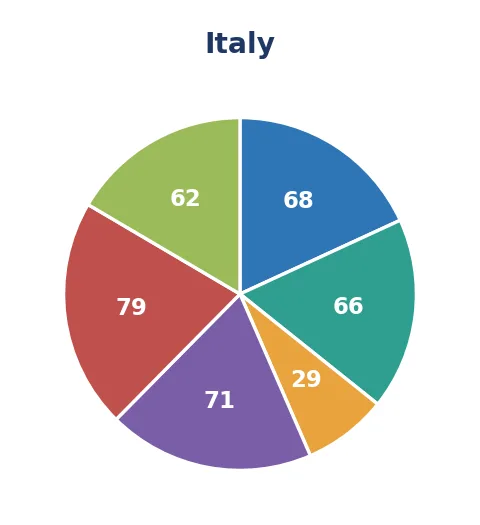
Relative to the EU27, Italy's strongest position is in attention to the environment (62%, 19 points above the EU benchmark of 43%), while its weakest is in a problem-free shopping experience (71% against the EU's 76%). Overall it beats the European average on 2 of the six indicators — including online purchasing and attention to the environment — and its highest single score is online purchasing at 79%. |
|
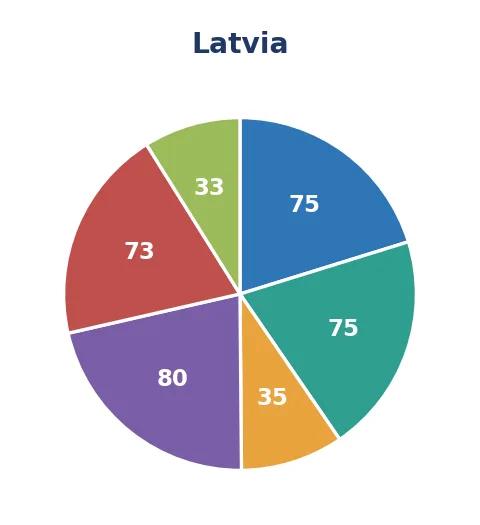
Relative to the EU27, Latvia's strongest position is in product-safety confidence (75%, 7 points above the EU benchmark of 68%), while its weakest is in attention to the environment (33% against the EU's 43%). Overall it beats the European average on 4 of the six indicators, with its highest single score being a problem-free shopping experience at 80%. |
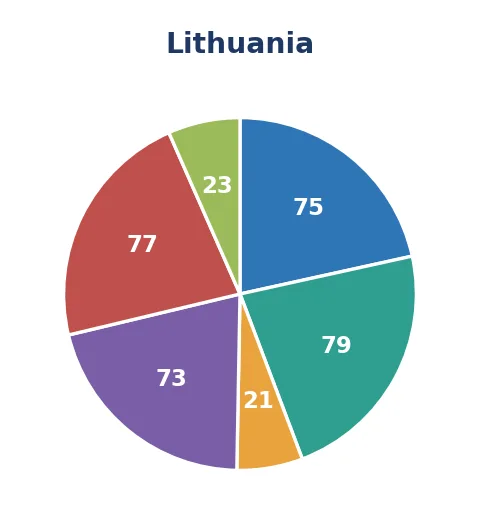
Relative to the EU27, Lithuania's strongest position is in product-safety confidence (79%, 11 points above the EU benchmark of 68%), while its weakest is in attention to the environment (23% against the EU's 43%). Overall it beats the European average on 3 of the six indicators — including trust in retailers, product-safety confidence and online purchasing — and its highest single score is product-safety confidence at 79%. |
|
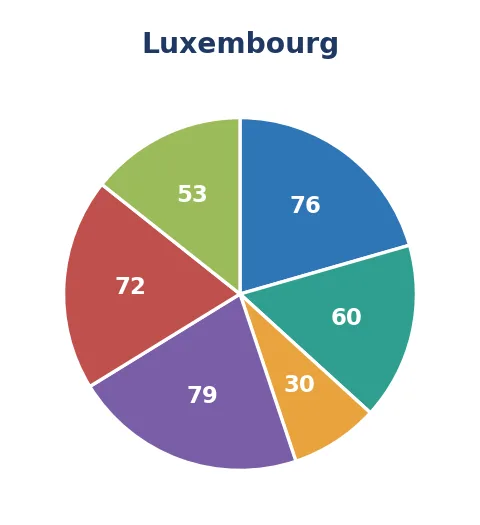
Relative to the EU27, Luxembourg's strongest position is in attention to the environment (53%, 10 points above the EU benchmark of 43%), while its weakest is in product-safety confidence (60% against the EU's 68%). Overall it beats the European average on 4 of the six indicators, with its highest single score being a problem-free shopping experience at 79%. |
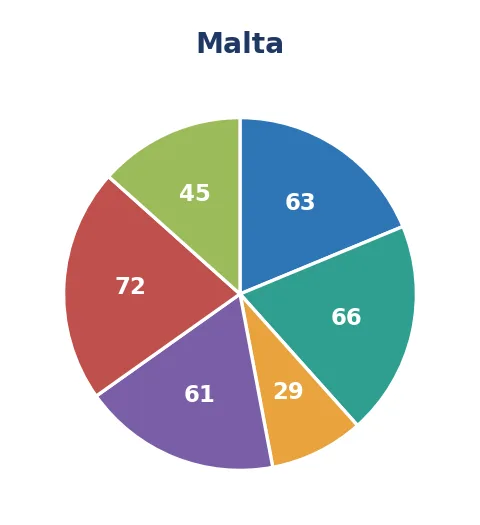
Relative to the EU27, Malta's strongest position is in attention to the environment (45%, 2 points above the EU benchmark of 43%), while its weakest is in a problem-free shopping experience (61% against the EU's 76%). Overall it beats the European average on 1 of the six indicator — including attention to the environment — and its highest single score is online purchasing at 72%. |
|
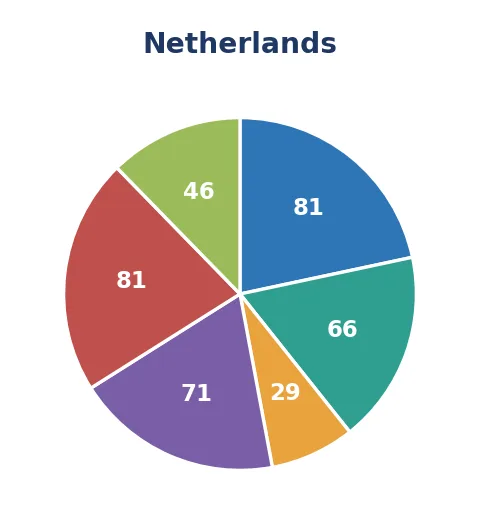
Relative to the EU27, Netherlands's strongest position is in trust in retailers (81%, 11 points above the EU benchmark of 70%), while its weakest is in a problem-free shopping experience (71% against the EU's 76%). Overall it beats the European average on 3 of the six indicators — including trust in retailers, online purchasing and attention to the environment — and its highest single score is trust in retailers at 81%. |
Relative to the EU27, Norway's strongest position is in attention to the environment (61%, 18 points above the EU benchmark of 43%), while its weakest is in trust in retailers (60% against the EU's 70%). Overall it beats the European average on 4 of the six indicators, with its highest single score being online purchasing at 91%. |
|
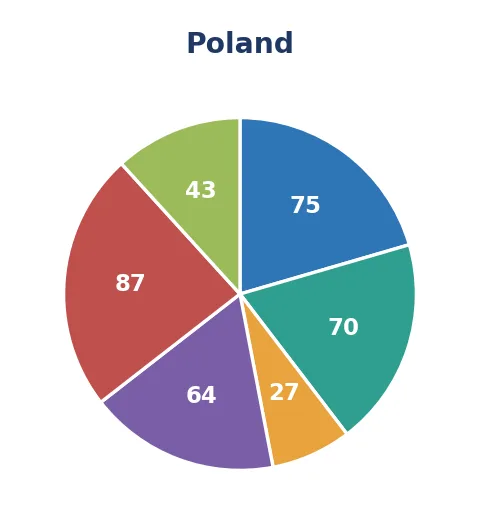
Relative to the EU27, Poland's strongest position is in online purchasing (87%, 11 points above the EU benchmark of 76%), while its weakest is in a problem-free shopping experience (64% against the EU's 76%). Overall it beats the European average on 3 of the six indicators — including trust in retailers, product-safety confidence and online purchasing — and its highest single score is online purchasing at 87%. |
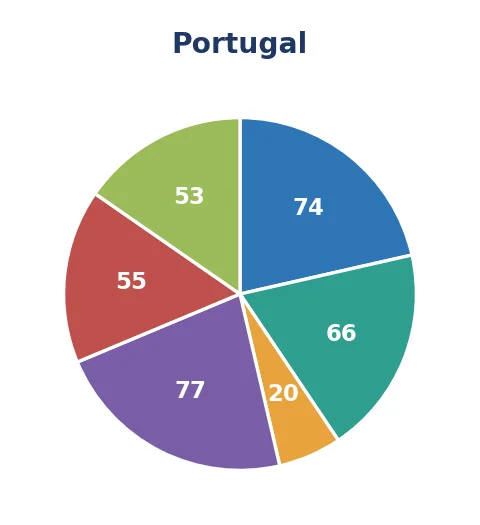
Relative to the EU27, Portugal's strongest position is in attention to the environment (53%, 10 points above the EU benchmark of 43%), while its weakest is in online purchasing (55% against the EU's 76%). Overall it beats the European average on 3 of the six indicators — including trust in retailers, a problem-free shopping experience and attention to the environment — and its highest single score is a problem-free shopping experience at 77%. |
|
Relative to the EU27, Romania's strongest position is in trust in retailers (74%, 4 points above the EU benchmark of 70%), while its weakest is in attention to the environment (33% against the EU's 43%). Overall it beats the European average on 1 of the six indicator — including trust in retailers — and its highest single score is trust in retailers at 74%. |
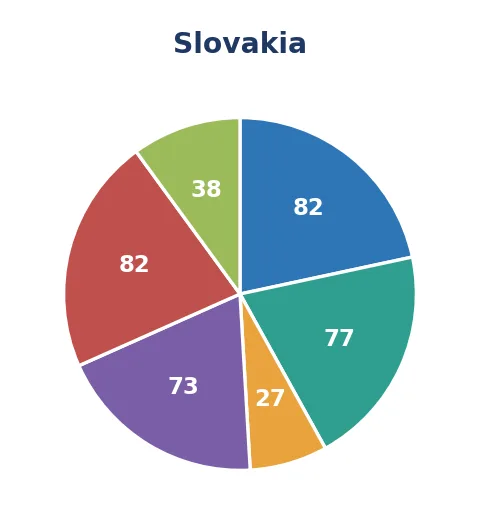
Relative to the EU27, Slovakia's strongest position is in trust in retailers (82%, 12 points above the EU benchmark of 70%), while its weakest is in attention to the environment (38% against the EU's 43%). Overall it beats the European average on 3 of the six indicators — including trust in retailers, product-safety confidence and online purchasing — and its highest single score is trust in retailers at 82%. |
|
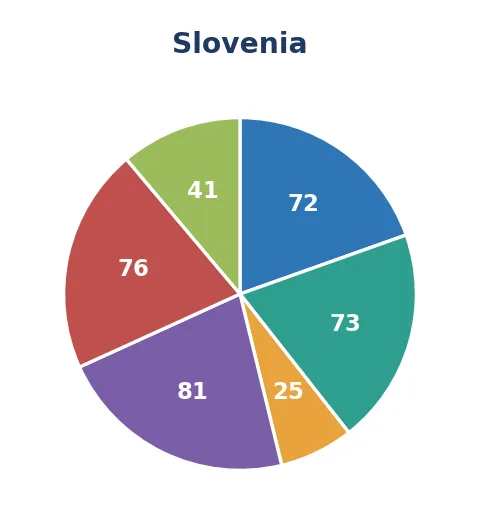
Relative to the EU27, Slovenia's strongest position is in product-safety confidence (73%, 5 points above the EU benchmark of 68%), while its weakest is in high knowledge of rights (25% against the EU's 29%). Overall it beats the European average on 3 of the six indicators — including trust in retailers, product-safety confidence and a problem-free shopping experience — and its highest single score is a problem-free shopping experience at 81%. |
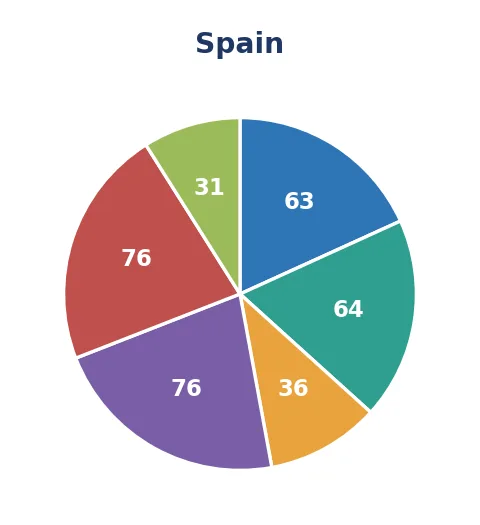
Relative to the EU27, Spain's strongest position is in high knowledge of rights (36%, 7 points above the EU benchmark of 29%), while its weakest is in attention to the environment (31% against the EU's 43%). Overall it beats the European average on 1 of the six indicator — including high knowledge of rights — and its highest single score is a problem-free shopping experience at 76%. |
|
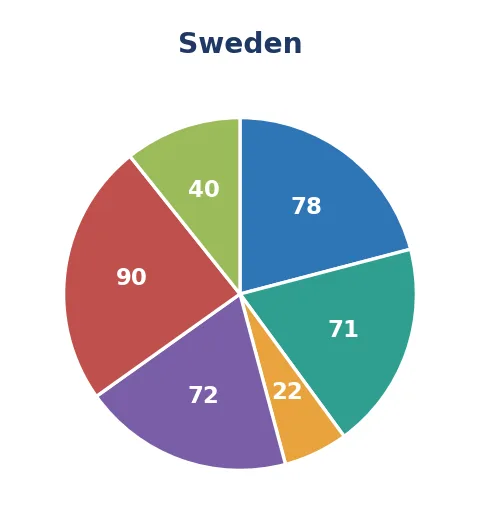
Relative to the EU27, Sweden's strongest position is in online purchasing (90%, 14 points above the EU benchmark of 76%), while its weakest is in high knowledge of rights (22% against the EU's 29%). Overall it beats the European average on 3 of the six indicators — including trust in retailers, product-safety confidence and online purchasing — and its highest single score is online purchasing at 90%. |


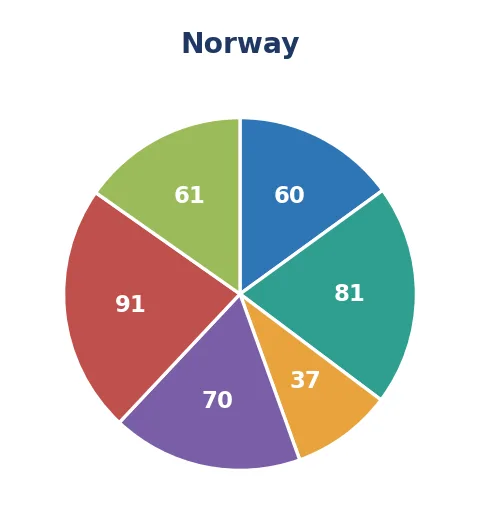
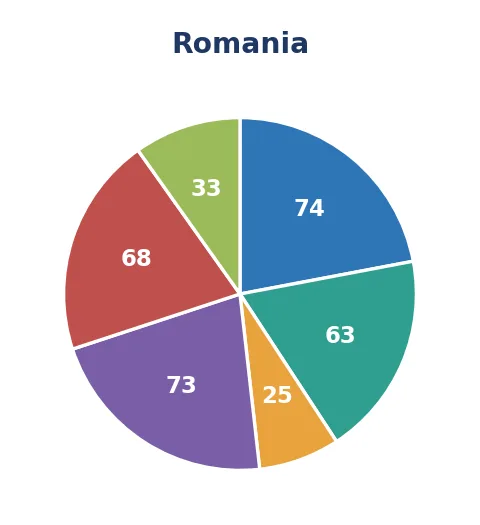
Read together, these twenty-nine fingerprints reveal Europe’s diversity at a glance. Trust in retailers ranges from Greece (44%) and Cyprus (47%) at the lower end to Austria (88%) at the top; attention to the environment peaks in Italy (62%) and Norway (61%) and bottoms out in Bulgaria (22%) and Lithuania (23%); and online purchasing is highest in Norway (91%), Sweden (90%) and Denmark (89%). Romania tracks close to the EU27 average on trust and product safety while trailing on formal knowledge of rights — a reminder of why consumer education remains a live priority. The lesson for any reader is the same: do not assume the EU average describes your country. These profiles exist precisely so you can check.
From Data to Daily Life: Putting the Scoreboard to Work
InfoCons Consumer Protection
Knowing the numbers is only half the value. The other half is acting on them. Here are practical ways the three core audiences — and any engaged consumer — can use the Scoreboard.
- Benchmark before you settle in. Newly arrived in an EU country? Check its profile first. If local satisfaction with complaint handling is low, document your purchases carefully and know your escalation routes from day one.
- Calibrate your online caution to the local fraud rate. With online fraud exposure ranging from 29% to 85% across countries, the level of vigilance that is appropriate in one Member State may be inadequate in another.
- Learn the four rights the survey tests. Distance-selling returns within 14 days, protection against one-sided price hikes, free repair or replacement within two years, and no obligation to pay for unsolicited goods. Knowing these four places you in the better-informed minority.
- Build coursework around it. The annexes list every survey question and official data source, so students can replicate analyses, test hypotheses about national differences, or critique the methodology — exactly the kind of evidence-based work that InfoCons champions in consumer education.
- Use it to spot policy in motion. The Scoreboard flags the direction of EU action — from the General Product Safety Regulation to the forthcoming Digital Fairness Act — making it a live bridge between consumer experience and consumer law.
Conclusion: A Mirror Worth Looking Into
InfoCons Consumer Protection
The European Consumer Conditions Scoreboard is, at heart, a mirror that 29 countries hold up to themselves once every two years. It reflects an EU where inflation has cooled but anxiety has not, where shopping is increasingly digital and increasingly risky, where green ambitions are being tested by tight budgets, where complaints are usually resolved yet satisfaction is sliding, and where confidence in product safety remains high even as the alert system works harder than ever.
For expatriates, it demystifies an unfamiliar market. For students, it offers rigorous, comparable, citable evidence. For teaching staff, it provides an authoritative, freely reusable reference in English that stays current. And for every consumer, it carries a simple, empowering message: your experience is being measured, it is being compared fairly across borders, and — once you know how to read it — it can help you make better, safer, more confident choices. The data is integrated, the comparison is honest, and the document is free. The only thing left is to open it.
Empowered, informed consumers are the foundation of a fair Single Market — and the Scoreboard is one of the clearest invitations Europe offers to become one.
The 29 Countries Covered by the Scoreboard
InfoCons Consumer Protection
For the record, here is the full roll-call of the twenty-nine countries that appear with data in the 2025 Consumer Conditions Scoreboard. The twenty-seven European Union Member States are Austria, Belgium, Bulgaria, Croatia, Cyprus, Czechia, Denmark, Estonia, Finland, France, Germany, Greece, Hungary, Ireland, Italy, Latvia, Lithuania, Luxembourg, Malta, the Netherlands, Poland, Portugal, Romania, Slovakia, Slovenia, Spain and Sweden. To these are added two members of the European Economic Area that are not part of the European Union — Iceland and Norway — bringing the total to twenty-nine countries, each surveyed with the same questionnaire in November 2024 and each measured against the EU27 average throughout this article.
Signature: InfoCons Communication Department
Source: European Commission, Consumer Conditions Scoreboard, 2025 Edition (Directorate-General for Justice and Consumers). Reused under the Creative Commons Attribution 4.0 International licence.