InfoCons · Consumer Protection · Green Transition Country Briefing
Denmark Ranks #14 of 29 on Europe’s Green-Shopping Map — 2 Points Below the EU Average | InfoCons Consumer Protection
How Denmark compares with 28 other European markets on the green transition — an InfoCons Consumer Protection briefing for English-speaking students, lecturers and expats in the EU.
Why This Denmark Briefing Exists, and How to Read It
This briefing zooms in on Denmark within the Green Transition chapter of the European Commission’s Consumer Conditions Scoreboard 2025, the Union-wide survey of consumer behaviour fielded by Ipsos in November 2024 across the 27 EU Member States plus Iceland and Norway. The comparison rests on the one green-transition indicator the Scoreboard reports for every country: the share of adults who say the environmental impact of a product influenced at least one recent purchase. The EU27 average is 43%.
|
Denmark at a glance Score: 41% of adults · Rank: 14 of 29 · Gap to EU27 average: -2 percentage points · Statistical band: second quartile of the 29 markets. |
Green Transition Theme 1 — Environmental Attention: Where Denmark Stands
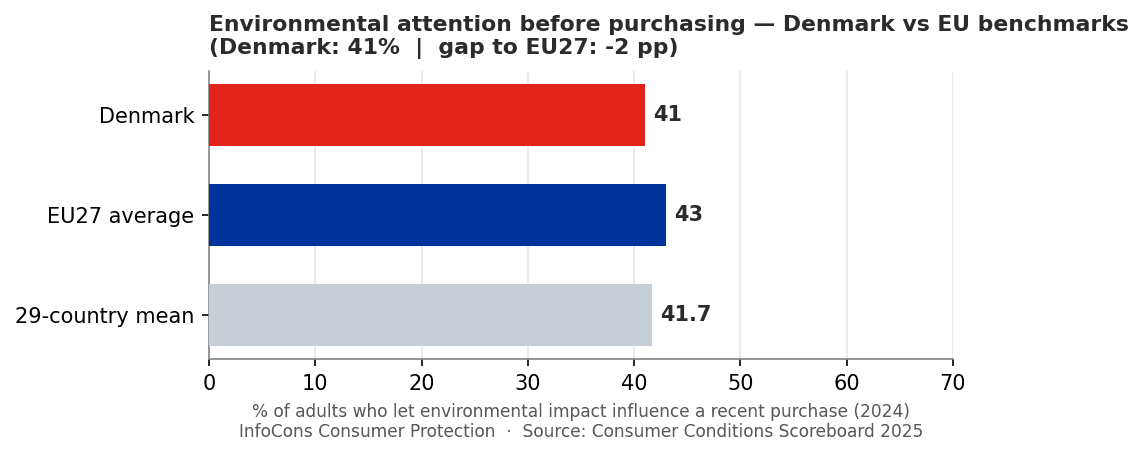
Denmark records 41% of adults letting the environmental impact of a product shape at least one recent purchase, placing it 14th of 29 markets. That is below the EU27 average of 43% by 2 percentage points, and below the unweighted 29-country mean of 41.7%. In statistical terms Denmark sits ahead of 41% of the field and is close to the European norm (a standardised score of -0.07 against a cross-country standard deviation of 10.2 points).
|
Environmental attention (2024) |
Denmark |
EU27 |
29-market mean |
Rank /29 |
Gap vs EU27 |
|
Adults influenced by environmental impact in a recent purchase |
41% |
43% |
41.7% |
14 |
-2 pp |
|
What this infographic shows — This first comparison chart sets Denmark’s 41% against two reference points: the EU27 average of 43% and the simple average of all 29 markets (41.7%). The 2-point distance between Denmark and the EU27 bar is the single most important figure in this briefing — it shows, at a glance, whether consumers here are more or less likely than the typical European to factor the environment into a purchase. |
|
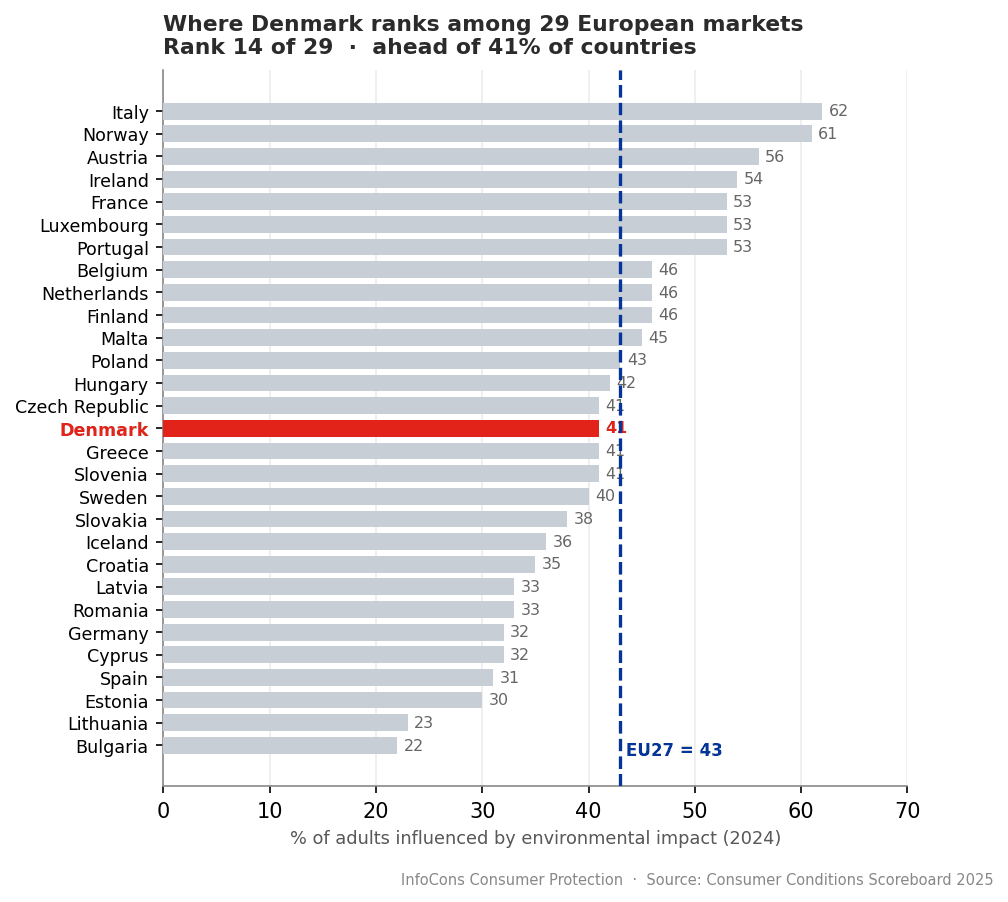
What this infographic shows — The second chart ranks every one of the 29 markets from Italy (62%) down to Bulgaria (22%), with Denmark highlighted in red and the EU27 average marked by the dashed line at 43%. Denmark appears just behind Czech Republic (41%) and just ahead of Greece (41%), which is why its rank is 14 of 29. Bars to the right of the dashed line beat the EU average; bars to the left fall short. |
|
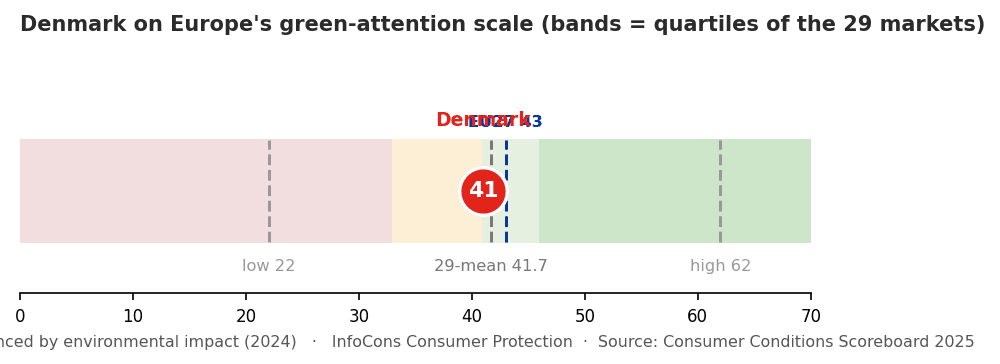
What this infographic shows — The third chart places Denmark on a 0–70 scale split into four coloured bands — the quartiles of the 29 national results (cut points at 33, 41 and 46). Denmark’s red marker at 41% falls in the second quartile, between the lowest market (Bulgaria, 22%) and the highest (Italy, 62%), with the EU27 average (43%) and the 29-market mean (41.7%) shown for reference. |
One caveat matters for readers using this for study or teaching: the EU27 figure fell 13 percentage points between 2022 and 2024, a decline common to 23 of the 27 Member States. Denmark’s position should therefore be read as a snapshot within a Union-wide retreat, not as a fixed national characteristic.
Green Transition Theme 2 — Barriers to Sustainable Consumption
Why do consumers — in Denmark and everywhere else — not buy sustainably more often? The Scoreboard measures this at EU level, and the answer points at the market rather than at apathy. The same frictions shape what is possible for shoppers in Denmark.
|
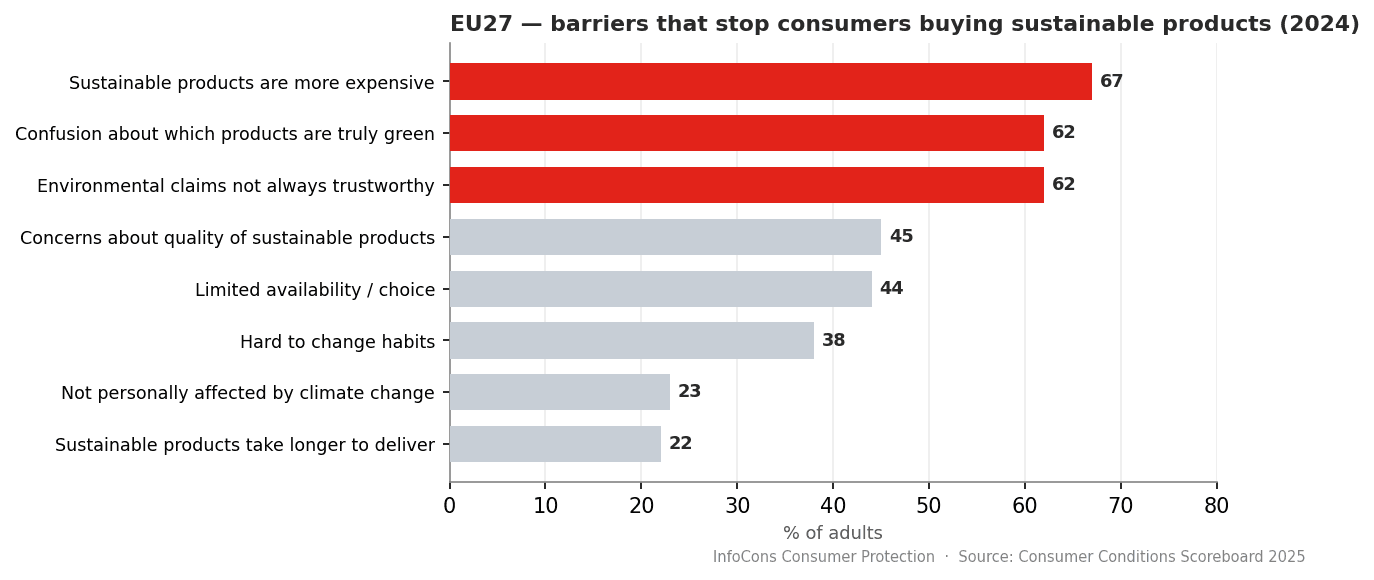
What this infographic shows — Reading the chart: just over two thirds of EU consumers (67%) say sustainable products simply cost too much. Almost identical shares cite confusion about which products are genuinely environmentally friendly (62%) and mistrust of environmental claims (62%). Quality concerns (45%) and limited availability (44%) follow, while only 23% say they are not personally affected — a small minority. The consumer-protection reading is that the levers are trustworthy information and fair pricing, not persuasion. |
Green Transition Theme 3 — Trust in Environmental Claims
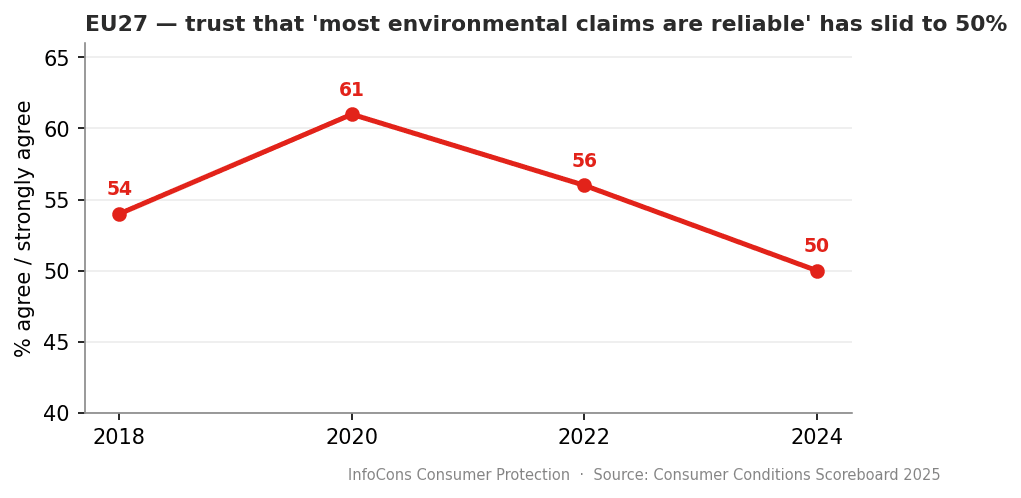
Trust is the quiet engine of the green transition: a shopper in Denmark who doubts a green label will discount it, however well-intentioned the purchase. Across the EU that trust is slipping.
|
What this infographic shows — Reading the chart: the share of EU consumers who agree that most environmental claims are reliable peaked at 61% in 2020, eased to 56% in 2022 and fell to 50% in 2024 — a six-point drop in two years. The Scoreboard attributes much of the recent fall to a small number of markets, notably France and Poland. The lesson for any country profile is that high attention and low trust can coexist, so attention alone does not guarantee a healthy green market. |
Green Transition Theme 4 — Repair or Replace?
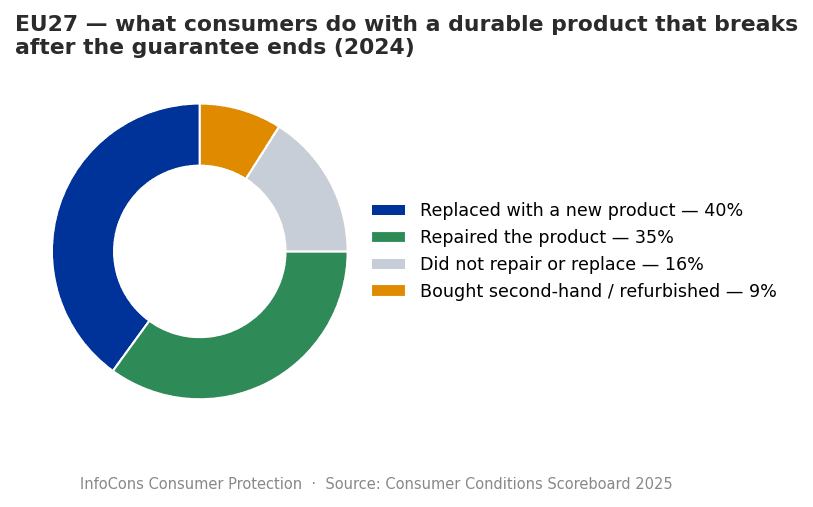
Repairing what we own is one of the most tangible green-transition choices, and it is governed by EU rules on guarantees and repairability that apply in Denmark too. The Scoreboard finds the EU split almost evenly.
|
What this infographic shows — Reading the chart: among the roughly three in ten consumers whose durable product (a phone, laptop or fridge) failed after its legal guarantee, 40% replaced it with a new product, 35% repaired it, and just 9% bought a second-hand or refurbished replacement. Cost is the overwhelming reason given for not repairing (61%), followed by a plain preference to replace (49%) — a pattern that maps directly onto the EU’s work on the right to repair. |
The Consumer-Protection Takeaway for Denmark
As a below-average market, the priority in Denmark is to convert willingness into behaviour. The 2-point gap to the EU average is driven mainly by the barriers in Theme 2 — cost, confusion and mistrust — rather than by indifference, since only a small minority of Europeans say the environment does not concern them. Clearer and verifiable environmental information, more affordable sustainable options and a genuine, affordable route to repair are the consumer-protection measures most likely to move Denmark up the ranking.
All figures in this briefing are drawn exclusively from the Green Transition chapter of the European Commission’s Consumer Conditions Scoreboard 2025 (Consumer Conditions Survey, fieldwork November 2024; EU27 plus Iceland and Norway). Denmark’s reading reflects the environmental-attention indicator in the Scoreboard’s country summaries; the barriers, trust and repair figures are reported at EU27 level.
Signature: InfoCons Consumer Protection Department for Green Transition